The visualiser
Four visualisations of whatever this machine is playing — not just Risocast — in a window you can leave in the corner of the screen.
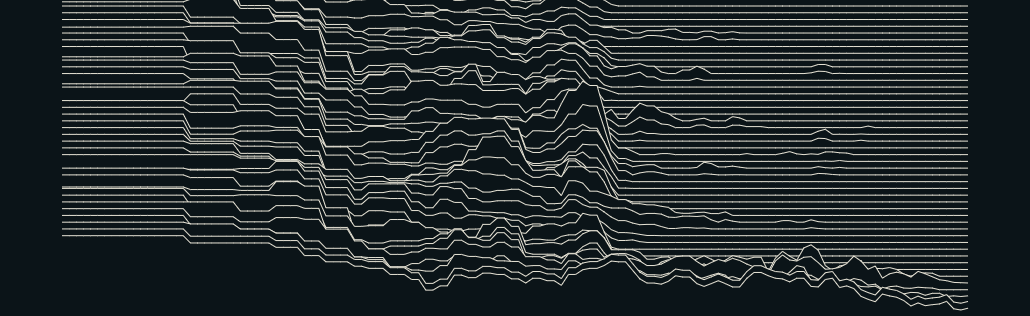
Four of them. Spectrum analyser is the bar meter with the falling caps. Oscilloscope is the waveform itself. Waterfall is the spectrum as colour, scrolling away from you, so you are looking at the last few seconds rather than this instant. Pulses stacks the spectrum as dozens of fine white lines.
Clicking the picture moves to the next one, the way a player of the era did it. Whichever you choose, the little visualiser in the deck at the foot of the window draws the same thing: it is one instrument seen from two distances.
Risocast’s own thirty-second clips are drawn with nothing switched on. To draw anything else — Spotify, a video, whatever the machine is playing — it reads the machine’s audio output, and that is always started by you.
The desktop app answers that without asking you to pick a source. In a browser tab you choose a tab or screen and tick share audio.
Nothing is recorded and nothing is sent anywhere. The waveform is drawn and thrown away.
Own window floats the visualiser above everything else, so it can sit in a corner of the desktop while you work, and the record it is drawing is named in its title bar. Full screen gives it the whole display.
best viewed at 1024×768 · get the desktop app · how this works · charts · privacy